Hiring an AI Developer? Here’s...
July 10, 2025

It is crucial to highlight that monitoring the right identical logs can significantly improve software development. In a microservices architecture, one operation may involve calling several APIs and thus, when an error is detected, it is difficult to debug the entire application.
Logs act as qualities that assist in carrying out superior analysis and identification of blunders. It helps sysadmins, support teams, and developers to monitor many various things that different services in the system do.
However, keeping this important data in a decentralized system with a number of applications, services, and systems may pose some challenges. The solution to this problem is provided by the ELK stack, a popular tool for log aggregation and analysis.
This article will illustrate how you can start using the ELK Stack and use it to gather, analyze, and store logs from your Spring boot application. Further, it will solve the problem of keeping the logs of several services in different windows, even in cases when these services are launched in one application, with the help of Kibana.
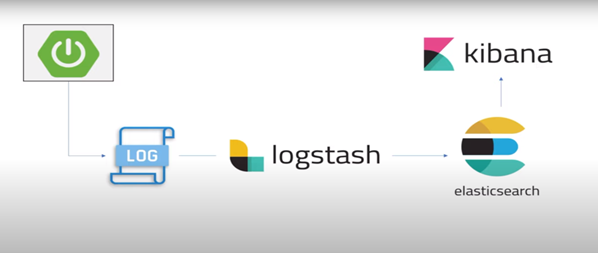
Logstash: The dedicated and reliable system that is used to parse and forward Spring Boot logs to Elasticsearch.
Elasticsearch: The most intense layer of the stack consists of an extremely useful search and analytical tool designed specifically for your log data.
Kibana: The visualization layer that allows us to transform complex log information into easily digestible graphics like dashboards and appealing charts.
At the end of this blog, you will have a fairly effective system of logs that can help you monitor your Spring Boot applications, obtain valuable information, and make improvements to their performance all thanks to the magic of logs!
Learn More: Spring Boot for WebRTC Signaling Servers
Kibana, the open-source jewel of the ELK Stack, transforms data exploration into a visual feast. Designed to work seamlessly with Elasticsearch, it acts as a user-friendly interface, empowering you to visualize, analyze, and comprehend the wealth of information stored within Elasticsearch indexes.se
Kibana’s arsenal includes the creation of dynamic dashboards, interactive charts, and ad-hoc queries, allowing you to unearth valuable insights from your data. Its intuitive interface and powerful visualization capabilities make it an indispensable tool for diverse applications – from log analysis and infrastructure monitoring to business intelligence.
Learn More: Spring Boot with Microsoft Azure Integration
Kibana, the open-source jewel of the ELK Stack, transforms data exploration into a visual feast. Designed to work seamlessly with Elasticsearch, it acts as a user-friendly interface, empowering you to visualize, analyze, and comprehend the wealth of information stored within Elasticsearch indexes.se
Kibana’s arsenal includes the creation of dynamic dashboards, interactive charts, and ad-hoc queries, allowing you to unearth valuable insights from your data. Its intuitive interface and powerful visualization capabilities make it an indispensable tool for diverse applications – from log analysis and infrastructure monitoring to business intelligence.
Logstash, the workhorse of the ELK Stack, acts as a powerful data pipeline. It ingests data from various sources, including logs, databases, and message queues, before refining and enriching it for further analysis. Imagine it as a data refinery, transforming raw materials into a usable format for insightful exploration.
Logstash boasts a diverse toolkit for data ingestion, supporting various sources like log files, databases, and network streams. It then applies filters and transformations to parse, structure, and enhance the incoming data, ensuring consistency and relevance before routing it to its final destination typically Elasticsearch.
This flexible architecture, coupled with an extensive plugin ecosystem, empowers organizations to seamlessly aggregate, process, and analyze data from disparate sources. With Logstash on board, real-time insights and informed decision-making have become a reality.
Unify and Unleash Insights: The Power of ELK for Spring Boot Logs
The ELK Stack (Elasticsearch, Logstash, and Kibana) offers a compelling solution for managing and analyzing logs from your Spring Boot applications. Here’s how it empowers you:
Overall, the ELK Stack provides a comprehensive solution for log management and analysis. It empowers organizations to optimize Spring Boot applications, improve troubleshooting efficiency, and gain unmatched operational visibility.
Learn More: Elasticsearch Integration with Spring Boot
In the intricate landscape of modern software development, efficient log management is paramount. Imagine a scenario where all the logs from your Spring Boot applications are consolidated into a single file, awaiting analysis. This setup is the foundation of a streamlined log management workflow, empowered by the ELK Stack – Elasticsearch, Logstash, and Kibana.


In most cases, logs are known to be an essential resource that any developer has to deal with especially when it comes to debugging applications. The Logstash enables delivering of logs in a centralized and scalable manner through the simplified ELK Stack. From this article, we commenced the debate on how ELK Stack functions and offered a guide on how to transmit Spring Boot application logs to the Elastic Stack (ELK).